Adding your CollectD metrics to Operations Management Suite
As of version v1.1.0-217 OMS Agent for Linux now has support for CollectD. CollectD is an open source Linux daemon that periodically collects data from applications and system level information. CollectD actually brings a lot of very useful plugins. Example applications CollectD can collect metrics from include the Java Virtual Machine, MySQL Server, Nginx, etc. CollectD is often used in combination with Grafana which enables you to create awesome dashboards to visualize the collected metrics.
If you are using OMS you might want to consider to forward the data from CollectD into Operations Management Suite. This is actually pretty easy to configure and once the data is present in OMS you can benefit from alerting and automation functionality OMS provides you with.
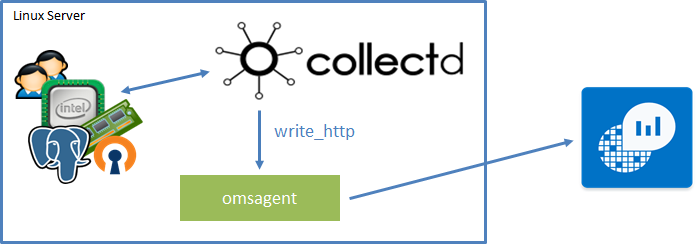
When installing the OMS Agent for Linux by using the –collectd switch, the agent listens on port 26000 for CollectD metrics and then converts them to OMS schema metrics. CollectD uses the default write_http plugin to forward metric data in JSON format over port 26000 to OMS Agent for Linux.
The following example was actually demoed at System Center Universe 2016. It uses CollectD and OMS Agent for Linux to collect ping, uptime and user metrics from different Linux boxes. These information are afterwards sent to OMS and visualized in a custom dashboard. There is also a post available on Microsoft Technet which describes the set up for metric retrieval from MySQL Server.
First of all you will need to install CollectD on your Ubuntu box. This can be done by using the following command. Make sure you use no-install-recommends because otherwise a lot of packages are installed which are not necessarily needed in this scenario
apt-get install collectd --no-install-recommends collectd
If OMS Agent for Linux is already installed on your machine, you can run the following command to set up CollectD to forward metrics to OMS Agent for Linux
sudo /opt/microsoft/omsagent/bin/omsadmin.sh –c
Now modify your CollectD configuration to make sure uptime, ping and users plugins are enabled. The Users plugin simply measures how many users are logged in on a host. This could be a good metric to create OMS alerts from. An unusual amount of logged in users on a host may be a sign of an ongoing attack or other suspicious activity.
The Ping plugin measures network latency using ICMP “echo requests”, usually known as “ping”. Network latency is measured as a round-trip time. So by monitoring the ping connectivity to your hosts you are able get some basic insights about your network performance.
vim /etc/collectd/collectd.conf

LoadPlugin uptime
LoadPlugin users
LoadPlugin ping
<Plugin "ping">
   Host "labvm01.lab.jhnr.ch"
   Host "labvm02.lab.jhnr.ch"
   Host "labvm03.lab.jhnr.ch"
</Plugin>
When working with the Ping plugin, make sure you install _liboping0 _package because this is required for proper functioning of the plugin. Unfortunately liboping0 is not included as dependency when installing collectd package.
sudo apt-get install liboping0
If you did not install liboping0 you will see the following error messages appearing in /var/log/syslog as soon as you restart collectd with Ping module installed:
Aug  7 10:49:01 LabVM03 collectd[4119]: lt_dlopen ("/usr/lib/collectd/ping.so") failed: file not found. The most common cause for this problem is missing dependencies. Use ldd(1) to check the dependencies of the plugin / shared object.
Aug  7 10:49:01 LabVM03 collectd[4119]: ERROR: lt_dlopen ("/usr/lib/collectd/ping.so") failed: file not found. The most common cause for this problem is missing dependencies. Use ldd(1) to check the dependencies of the plugin / shared object.
Aug  7 10:49:01 LabVM03 collectd[4119]: plugin_load: Load plugin "ping" failed with status 1.
Aug  7 10:49:01 LabVM03 collectd[4119]: Found a configuration for the `ping' plugin, but the plugin isn't loaded or didn't register a configuration callback.
After configuring CollectD, it is now time to install the OMS agent for Linux. Make sure you are using the –collectd switch
sudo sh ./omsagent-1.2.0-25.universal.x64.sh --upgrade --collectd -w <YOUR OMS WORKSPACE ID> -s <YOUR OMS WORKSPACE PRIMARY KEY>
When using _–collectd _switch, the OMS install routine will actually add a config file oms.conf to _/etc/collectd/collectd.conf.d. _This conf file will make sure that CollectD is forwarding all the metrics in JSON format to OMS Agent for Linux using the write_http plugin.
vim /etc/collectd/collectd.conf.d/oms.conf

LoadPlugin write_http
<Plugin write_http>
     <Node "oms">
         URL "127.0.0.1:26000/oms.collectd"
         Format "JSON"
         StoreRates true
     </Node>
</Plugin>
The OMS Agent for Linux listens on port 26000 for CollectD metrics and then converts them to OMS schema metrics. To have a common model between infrastructure metrics that are already collected by the OMS Agent for Linux and the additional metrics that CollectD gathers, the following schema mapping is used:

If everything went well and , you should soon see some CollectD metrics data populated in your OMS workspace. If not, you probably have to restart CollectD service because it did not yet pick off the configuration changes made by OMS Agent for Linux installation routine.
service collectd restart
As you notice, the CollectD type (users in this case) is mapped to the ObjectName field in OMS.
Now that the data is available in OMS, you can pretty easily create some custom dashboards based on your CollectD metrics. You can download the below dashboard from here.

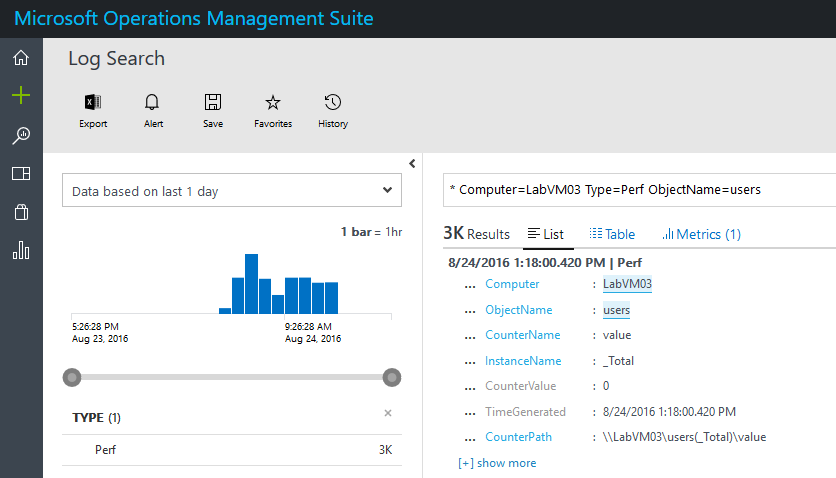
For example, use a query like the following to get logged in users aggregated by computer.
Type=Perf ObjectName=users | measure max(CounterValue) by Computer interval 5minutes
When working with the Ping metrics you want to aggregate on CounterName field because that is where the host name of the pinged computer is found. The following should give you the average RTT for a given host.
Type=Perf ObjectName=ping | measure avg(CounterValue) by CounterName interval 5minutes